Lab 6 – SIEM Deployment & Log Collection
Deploy a lightweight SIEM solution to collect, normalize, and visualize logs from your domain controller, client, and firewall.
Objective Lab goal
This lab introduces centralized log collection and analysis using a lightweight SIEM platform. You’ll deploy a SIEM VM, configure log sources from DC01, WIN10‑LAB, and OPNsense, and validate ingestion and dashboard visibility.
- Outcome 1: SIEM VM deployed and operational.
- Outcome 2: Logs collected from Windows and OPNsense.
- Outcome 3: Dashboards and alerts visible in SIEM console.
- Outcome 4: Foundation for alert tuning and incident response.
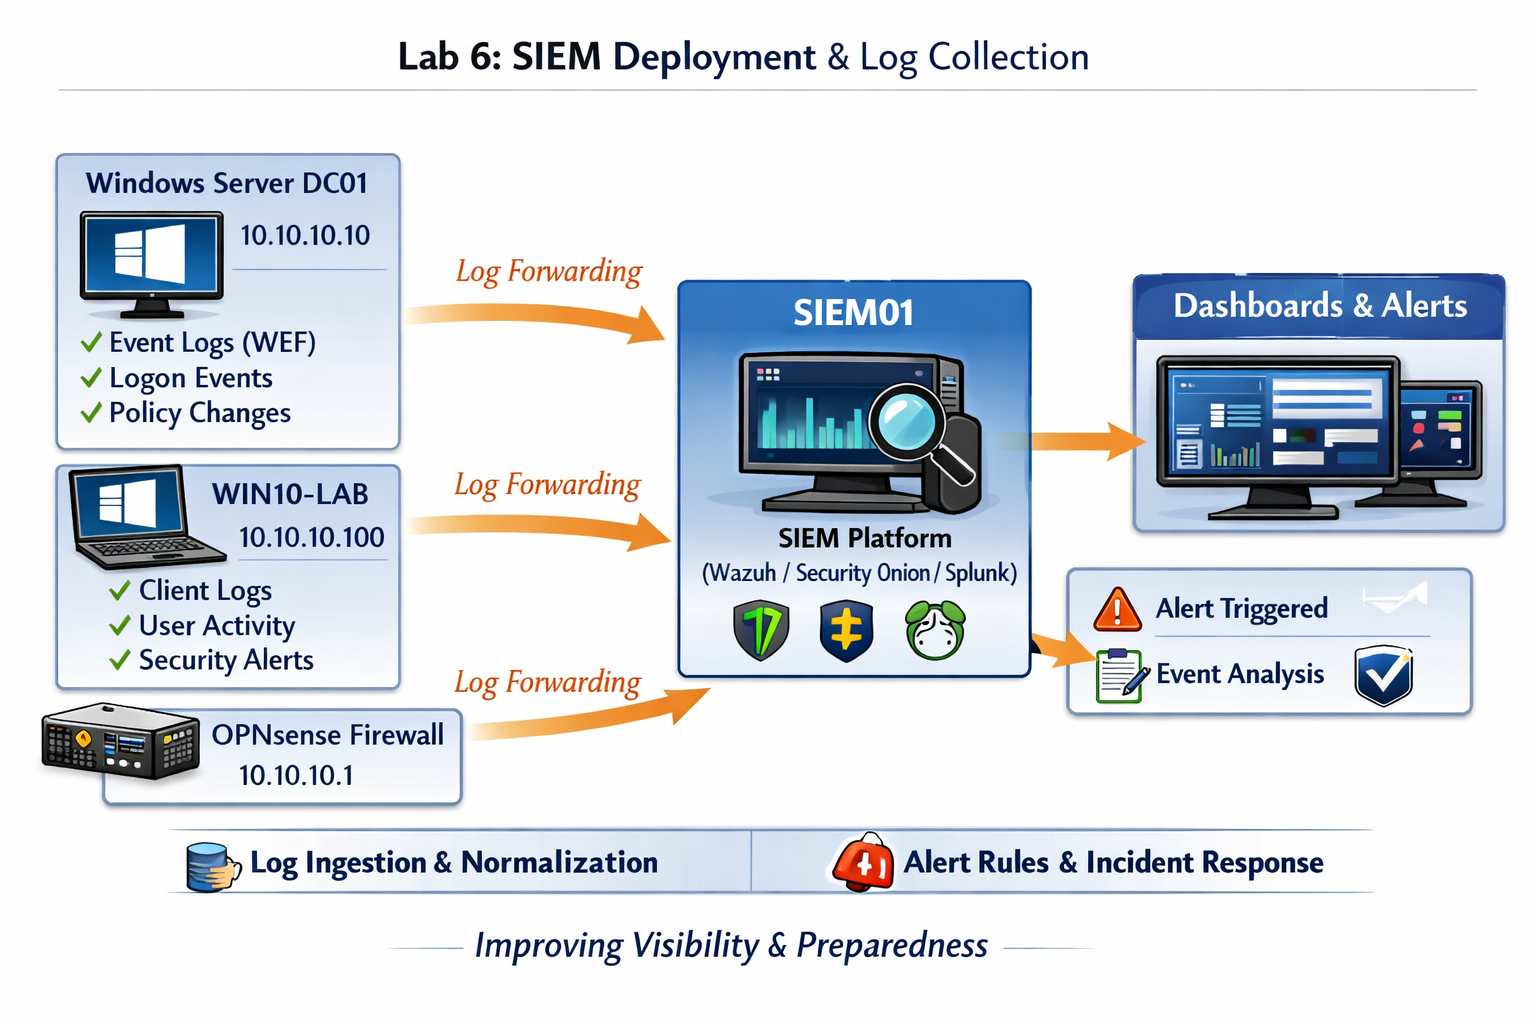
Lab 6: Deploying a lightweight SIEM and integrating log sources from DC01, WIN10‑LAB, and OPNsense.
Deliverables End‑of‑lab checklist
- DL6.1: SIEM VM deployed and reachable.
- DL6.2: Log sources configured (DC01, WIN10‑LAB, OPNsense).
- DL6.3: Dashboards populated with event data.
- DL6.4: Basic alert rules created and tested.
- DL6.5: Documentation of SIEM configuration.
Lab Steps Step‑by‑step instructions
Step 1 – Deploy SIEM VM
~30 minutes- Download your preferred SIEM ISO or installer (Wazuh, Security Onion, or Splunk Free).
- In Proxmox, create a new VM named SIEM01.
- Assign:
- CPU: 4 vCPUs
- RAM: 8 GB
- Disk: 100 GB
- Network: vmbr10 (Lab LAN)
- Install the SIEM OS and verify network connectivity.
Step 2 – Configure Log Sources
~45 minutes- On DC01, enable Windows Event Forwarding (WEF) subscription for Security and System logs.
- On WIN10‑LAB, confirm WEF client configuration:
wecutil es /enum-subscription
- On OPNsense, enable remote syslog under System → Settings → Logging / Targets.
- Point all sources to SIEM01 (10.10.10.x).
Step 3 – Validate Log Ingestion
~30 minutes- Log in to SIEM web console.
- Check incoming data streams for Windows and syslog sources.
- Verify event types appear in dashboards (Security, System, Firewall).
- Run a test logon event on WIN10‑LAB and confirm visibility in SIEM.
Step 4 – Create Basic Alerts and Dashboards
~45 minutes- Create alerts for:
- Failed logons (Windows Event ID 4625)
- Policy changes (Event ID 4739)
- Firewall blocks (OPNsense syslog)
- Design a dashboard showing:
- Authentication events by host
- Top alerts by severity
- Event volume over time
Step 5 – Document Configuration and Results
~20 minutes- Record SIEM version, log sources, and alert rules in your documentation folder.
- Save screenshots of dashboards and alert tests.
- Save screenshots of dashboards and alert tests.
- Export SIEM configuration summary for future reference.
Reflection What you should understand now
- Visibility: How centralized logging reveals system and network activity across your homelab.
- Detection: How SIEM tools correlate events and generate alerts for suspicious behavior.
- Integration: How Windows Event Forwarding and syslog connect heterogeneous systems into a single monitoring plane.
Your homelab now has a fully operational SIEM collecting logs from multiple sources. In Week 7, you’ll focus on alert tuning and dashboard design to refine signal‑to‑noise ratio and visualize key security metrics.