Lab 7 – Alert Tuning & Dashboard Design
Refine your SIEM’s detection logic, reduce false positives, and design dashboards that visualize key security metrics across your homelab.
Objective Lab goal
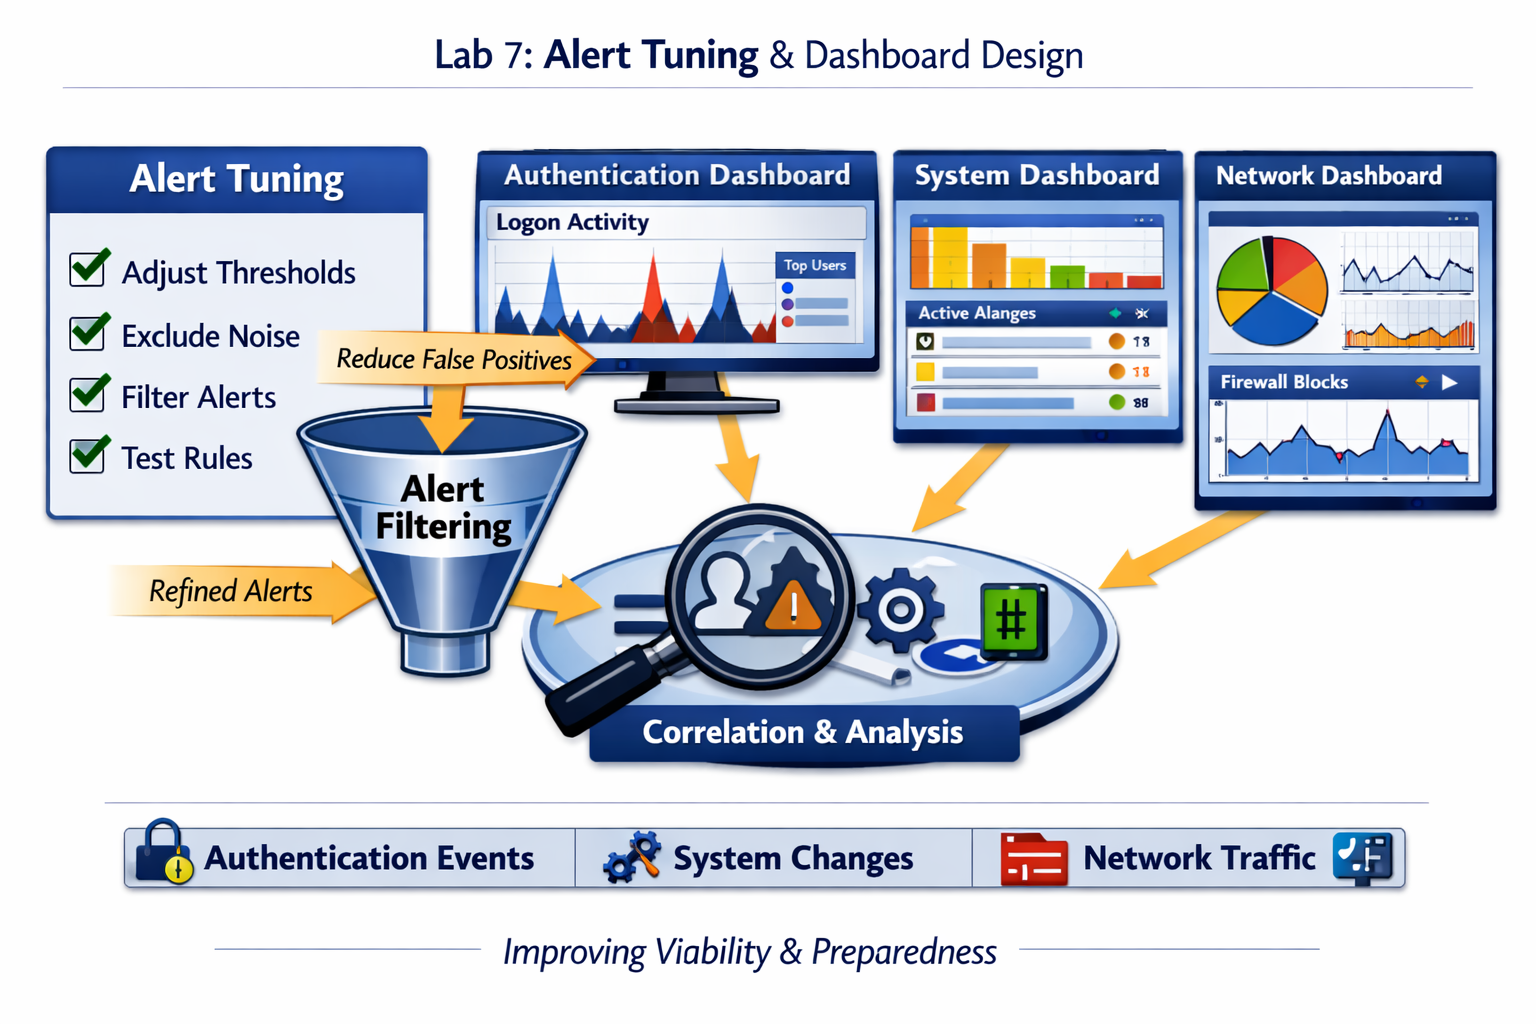
This lab focuses on improving the quality of alerts and visualizations in your SIEM. You’ll tune thresholds, filter noise, and design dashboards that highlight authentication trends, system changes, and network anomalies.
- Outcome 1: Alert rules refined to reduce false positives.
- Outcome 2: Dashboards created for authentication, system, and network events.
- Outcome 3: Visual correlation between alerts and event sources.
- Outcome 4: Improved signal‑to‑noise ratio for incident detection.
Lab 7: Refining SIEM alert rules and designing dashboards for authentication, system, and network visibility.
Deliverables End‑of‑lab checklist
- DL7.1: Alert rules tuned and validated.
- DL7.2: Dashboards created for key event categories.
- DL7.3: False positives reduced by at least 30 %.
- DL7.4: Dashboard screenshots saved for documentation.
- DL7.5: Updated SIEM configuration exported.
Lab Steps Step‑by‑step instructions
Step 1 – Review Existing Alerts
~20 minutes- Log in to SIEM console and open the Alerts tab.
- Identify alerts triggered in the past 24 hours.
- Classify each alert as true positive or false positive.
- Document patterns of repeated false positives (e.g., routine logons or scheduled tasks).
Step 2 – Tune Alert Thresholds and Filters
~45 minutes- Adjust thresholds for failed logons and policy changes to reduce noise.
- Exclude known service accounts and scheduled tasks from alert rules.
- Use SIEM query filters to focus on critical hosts and users.
- Test new rules by simulating logon failures and policy updates.
Step 3 – Design Dashboards for Visibility
~60 minutes- Create three dashboards:
- Authentication Dashboard: Failed logons, successful logons, top users.
- System Dashboard: Policy changes, Defender alerts, critical updates.
- Network Dashboard: Firewall blocks, IDS alerts, traffic volume.
- Use color coding for severity levels and trend lines for event frequency.
- Save each dashboard layout for future comparison.
Step 4 – Validate and Document Results
~30 minutes- Trigger a test alert and verify dashboard updates in real time.
- Capture screenshots of each dashboard and save them in your documentation folder.
- Export SIEM configuration and alert rules for backup.
Reflection What you should understand now
- Optimization: How alert tuning improves accuracy and reduces noise.
- Visualization: How dashboards translate raw logs into actionable insight.
- Correlation: How event relationships reveal patterns of potential threats.
Your SIEM now provides clear, actionable visibility into your homelab’s security posture. In Week 8, you’ll simulate an incident to test your alerting and response workflow.